
The macro backdrop of 2026 is defined by two powerful and simultaneous impulses: the economic aftershocks of geopolitical conflict and an intense technology cycle reshaping corporate productivity. Activity boosters – defense spending, reconstruction, US midterm dynamics, and AI capex – are keeping growth above consensus.
Yet inflation remains sticky in the near term, the Fed is on hold with 70% of the market pricing no cut in 2026, and fixed income sits on a tightrope with the risk of prolonged negative real rates undermining the credibility of both the Fed and the Bank of England. Against this backdrop, financial markets have entered a risk-on, late-cycle rally phase. This paper discusses the later issues while addressing the hedging strategies to deploy.
U.S. equity market is priced for perfection
We indeed feel that financial markets have entered a risk-on, late-cycle rally phase. Earning Yield Gaps (Earning Yield minus the risk-free rate) on both the S&P 500 and the Nasdaq are deeply depressed. By our measure, EYG is signaling that valuations are demanding. The market is not necessarily overvalued if margins hold and rates stay contained, but it is unambiguously priced for perfection, leaving little room for disappointment.
| Fig. 1 – S&P500 Earnings Yield Gap |
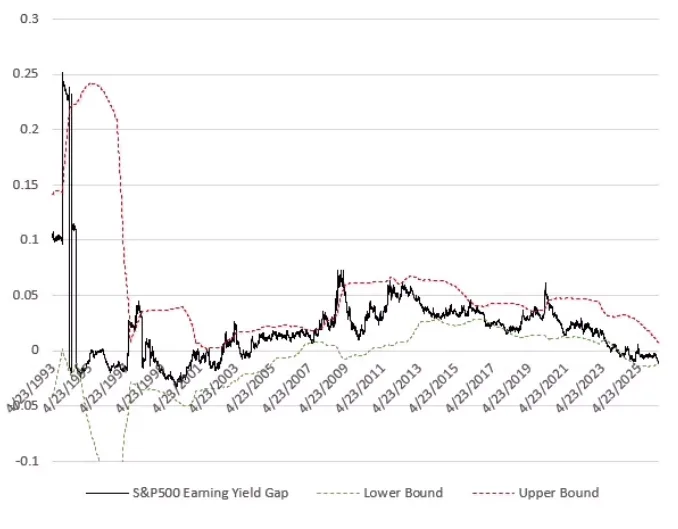 |
| source: CPCA |
Today’s fundamentals — corporate margins near cycle highs and credit spreads signalling a benign macro backdrop — justify an elevated market. Expensive, however, is not synonymous with overvalued: the distinction matters. A sustained margin compression or a rate spike would mechanically warrant multiple contraction, shifting the market from fairly priced for the cycle to genuinely stretched. That threshold is what investors must monitor — not the price level itself, but the conditions that would no longer support it.
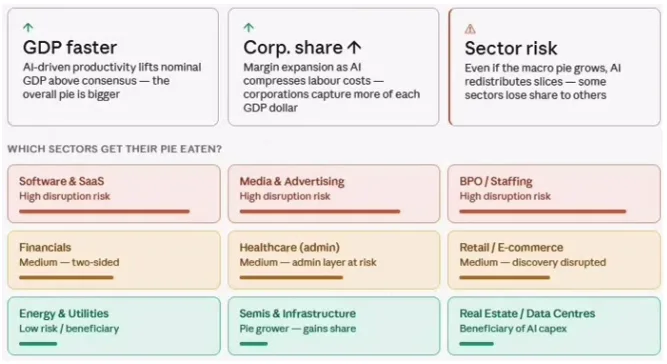
Which brings us to the bull case — and its internal contradiction. The constructive scenario rests on two pillars: corporate profit share of GDP continuing to rise, and nominal GDP growing faster than consensus expects. Both are plausible. Both are also, in aggregate, a zero-sum exercise. At the sector level, every dollar of margin expansion is a dollar extracted from someone else’s revenue line.
AI accelerates this dynamic rather than dissolving it: if productivity gains lift GDP and compress corporate costs, those compressed costs are another sector’s lost revenue. The aggregate pie grows, but the distribution across sectors shifts violently — making index-level optimism insufficient and sector selection, once again, the only game worth playing.
| Fig. 2 – US corporate profits are strong |
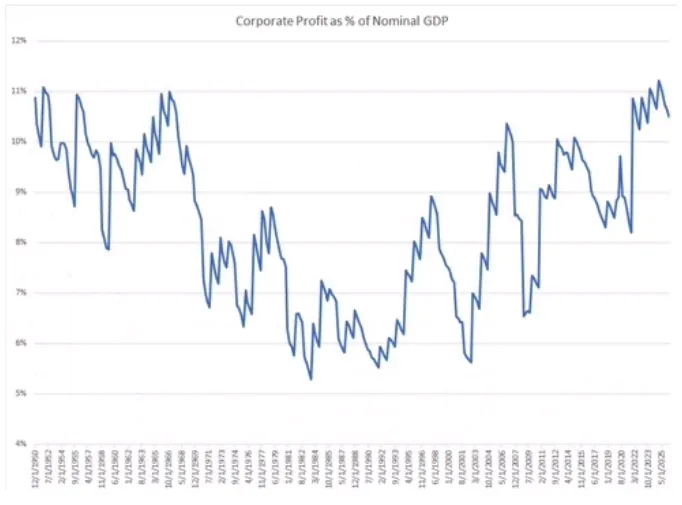 |
| source:CPCA |
Sentiment and volatility underneath
Sentiment and positioning confirm what valuation already implies. Goldman Sachs’ Risk Appetite Indicator has crossed above 1.0 – its highest reading since 2021 and higher than 99% of all observations since 1991 – while the US equity momentum index has surpassed 3.0 for the first time since the Dot-Com Bubble.
Critically, this is only the second occurrence since 2000 where both indicators have reached such extremes simultaneously. The conclusion is straightforward: a significant amount of good news is already embedded in prices, and with margin debt elevated, the market’s tolerance for disappointment is thin.
| Fig. 3 – Risk appetite and equity momentum |
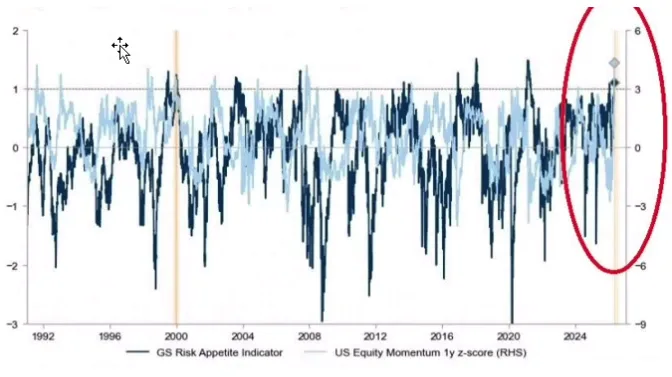 |
| source:GS |
What makes this positioning picture more unsettling is what lies beneath the surface. The S&P 500 Gamma — a measure of how aggressively market makers must buy or sell futures to hedge their options books — has surged from deeply negative levels in late March to its highest point since 2021, at the fastest pace ever recorded.
| Fig 4: S&P500 Gamma swings |
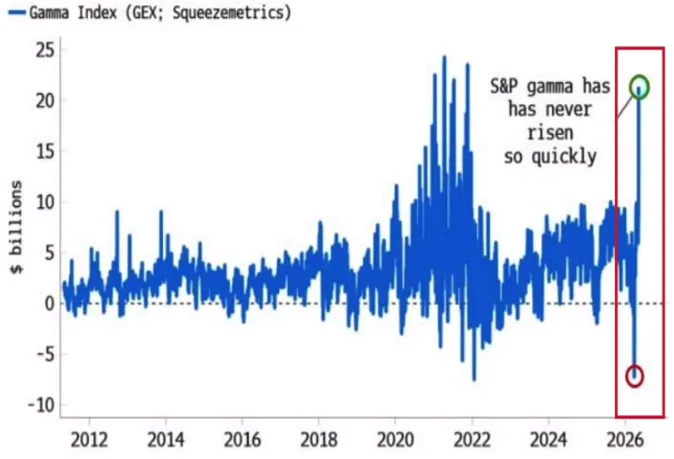 |
| source: Squeezematrics |
The only comparable episode was late 2021, when an identically extreme gamma configuration preceded a market top by just one to two months. When gamma is positive and rising, market makers act as a natural stabilizer, mechanically buying dips and selling rallies. But when it swings this violently from negative to positive, that apparent calm is a structural illusion – the market’s stability is borrowed, not earned. Driven largely by extreme speculative activity in semiconductor stocks, this setup carries a clear implication: when the reversal comes, it will not be gradual.
Hedging strategy implications
On the equity hedging question specifically, the volatility surface offers a clear answer.
We are not in a panic regime – realized vol has compressed back toward 12%, ATM implied volatility is roughly in line with realized, and the market surface is calm on the surface. But downside skew is steep: the 90% strike is dramatically richer than ATM, meaning crash insurance is expensive while the skew itself can be harvested.
The practical implication is direct — for investors long equities and fearing a moderate 5–10% correction, a put spread dominates: buy the 97.5% put, sell the 90% put. The short wing is overpriced by the market’s own fear. We are actively following risk repricing dynamics here and will eventually use that fear against itself to hedge our positions while we keep on participating to the market through our liquid and P.E. investments.