

September’s “nobody wants US debt” thesis had its first market consequence in October. On 7 October the US 10-year reached 5.37%, the highest print since April 2002, and the response was mechanical: buyers stepped in above the five-handle, Fed hike odds on Kalshi collapsed from roughly 70¢ in late September to 7-8¢ by month-end, and the shock rolled into the most crowded corner of the equity market — AI and tech momentum — with a violence we have not seen in a quarter century. This note focuses on that specific event: the AI factor unwind, the business-model audit that came with it, and the positioning changes we made across the sleeve.
A factor unwind, not a sector collapse
Morgan Stanley’s US TMT Momentum Factor fell 62% from its 12-month high in October — a drawdown deeper than either the dot-com unwind or the GFC trough (figure 1). The factor recorded 65 daily moves exceeding ±5% in 2026 alone, against 70 across the entire 1999-2001 period.
| Fig. 1 – TMT momentum crash |
 |
| Source: Morgan Stanley |
Yet beneath the headline, S&P composite breadth remained neutral at 54.7%, with 65.5% of names above their 20-day moving average (figure 2). This matters for the trade: a factor unwind is not a sector collapse, and in a factor unwind the cheapest insurance is reducing crowding, not shorting the index. CalPERS cut its Mag 7 holdings by roughly 25% in the first half of 2026, after hedge funds had already sold. When the slowest money in the market starts rotating, that is a signal, not noise.
| Fig. 2 – S&P500 breadth |
 |
| Source: CCA |
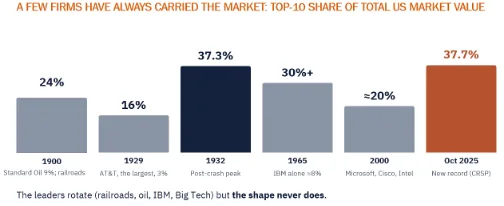
The structural frame underneath this is sharper than the dot-com comparison suggests. US market concentration — the top-10 share of total US market value — reached 37.7% in October per CRSP, surpassing the May 1932 peak of 37.3% (figure 3). Only approximately 29% of S&P 500 names have outperformed the index over the trailing three years, a reading near the 2000 low of 25%; 84% of S&P 500 stocks sit at least 10% below their all-time highs even as the index tests new ones. This is not an AI-cycle anomaly — concentration is the default state of US equity markets — but the level is now at a centennial extreme, and extremes mean-revert with considerable energy when they do.
| Fig. 3 – 125 years of concentration |
 |
| Source: Global Financial Data, “200 Years of Market Concentration”; CRSP via Morningstar (2025); LCP; Bridgewater |
The AI business model gets its first real audit
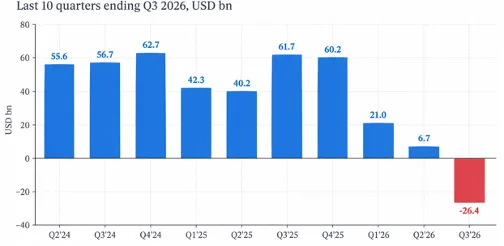
The arithmetic gap in AI unit economics became visible this month, and it is material. Data-centre owners require approximately $8.5 trillion of revenue through 2030 against a forecast of $3.6 trillion — a $4.9 trillion shortfall — with roughly $1 trillion of AI capex added in 2026 alone and Gartner suggesting more than $3.5 trillion could be written down by 2030. Anthropic’s token price fell 48% in a month, catching down to OpenAI, while Ramp’s data shows companies using more AI but spending no more on it since July. For the first time in decades, aggregate free cash flow across Microsoft, Amazon, Meta and Alphabet has turned negative (figure 4). Google’s single $1 trillion in forward commitments captures the scale of what is being underwritten against revenues yet to appear.
| Fig. 4 – Aggregate FCF of Google, MSFT, AMZ & META |
 |
| Source: Companies Filling |
Anthropic’s S-1 is worth reading on its own: a $0.7B operating loss on $16.3B of revenue in H1 2026 with Q2 already profitable at the operating level, approximately +$3.4B of free cash flow, and $132B of cash and short-term investments — but $125B of five-year equipment leases and other compute obligations that will not appear in capex but will be paid. That $125B is the honest number to watch. The business is not broken; the cash obligation is enormous.
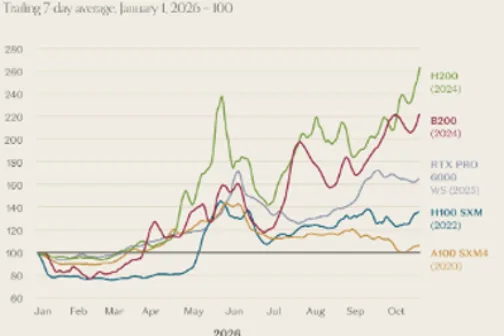
| Fig. 5: It still costs more to rent a GPU than it did 10 months ago (even for the oldies) |
 |
| Source: A16Z |
Running against this is the Jevons argument, which has non-trivial empirical support. GPU rental prices for 2020-vintage hardware are rising, not falling — compute demand is outpacing the rate at which efficiency gains free it up (figure 5). If cheaper tokens drive more total compute demand, falling output prices do not crash the capex cycle. The investable translation is a clear ordering within the AI chain: chip and data-centre owners win in the near term because compute is scarce; AI labs get squeezed between collapsing output prices and rising input costs; neoclouds built on borrowed money are the most exposed — Gartner expects 80%+ to disappear as standalone entities by 2030. Which part of the AI chain you own matters more than whether you own AI.
Positionning: tactical in factor-unwind regime, with midterm statistics in view
Core allocation broadly unchanged. We cut our long gold as key levels were broken on the downside; we kept the energy-of-AI basket around XLU, URA (which is now a value trade) and GRID; aerospace & defence via PPA and ITA; the credit, dividend and communication-services tilt; and the trend-follower sleeve, which has delivered double-digit YTD returns with low volatility and remains long cross-asset momentum.
Tactical shifts in October were three. We cut fixed income at the top of the rebound as the real-yield regime is range-bound around a higher clearing level, not resolving to a durable rally. In tech, we remained long through the 13 October signal; by month-end the factor unwind had re-opened the risk-reward on a tactical basis, so we treat tech as a rental, not an own-and-hold, hedged against the VIX call spread structure described in September. For clients with higher risk appetite, we cut exposure in crypto — Bitcoin now needs +53% to retake its high and we respect the technical tripwire.
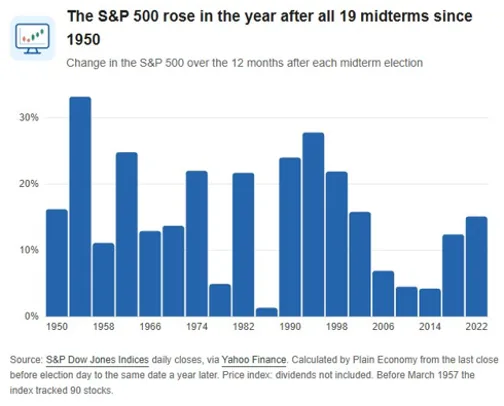
The single clearest statistical argument for staying invested through the near-term wobble is the midterm statistic: the S&P 500 has been higher 6 and 12 months after every midterm election for the last 75 years, with a 100% hit rate and an average 12-month gain of ~15.5% (figure 6).
| Fig. 6: S&P500 over the 12 months after each midterm election |
 |
| Source: A16Z |
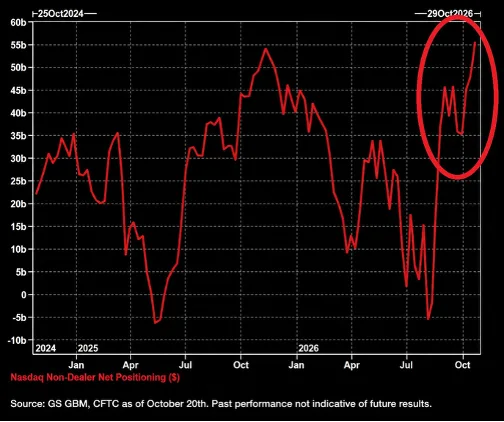
The honest counter is that positioning is extreme — speculative investors added ~$60B in Nasdaq futures over the two months into end-October, the largest two-month increase on record, pushing non-dealer net positioning to a two-year high just before the TMT factor unwind hit (figure 7). We resolve those two facts by staying invested in the core, treating tech as a rental, keeping the hedges on, and respecting the first-signal nature of what October delivered.
The June note said the market’s calm was borrowed. The September note said the exit was visible in the flow data. October said: here is what the first mechanical repricing looks like — fast, concentrated, factor-driven, and almost certainly not the last. We continue to rotate accordingly.
| Fig. 7: COT positionning for Nasdaq |
 |
| Source: COT |
The information, opinions, and analysis contained in this publication (“The View”) are provided by Crosspoint Capital Asia Pte. Ltd. (UEN: 201010341G) for informational purposes only and do not constitute investment advice, recommendations, or solicitations to buy or sell any securities or financial instruments. Market Commentary & Opinions: All views expressed herein represent the opinions of Crosspoint Capital Asia as of the date of publication and are subject to change without notice. These opinions are based on current market conditions and may not reflect future market performance. Not Investment Advice: This content should not be construed as personalized investment advice or recommendations tailored to your specific financial situation, investment objectives, or risk tolerance. Investment decisions should be made only after consultation with qualified financial advisors who can assess your individual circumstances. Risk Disclosure: All investments carry inherent risks, including the potential loss of principal. Past performance is not indicative of future results. Market conditions, economic factors, and geopolitical events can significantly impact investment performance. No Guarantee: Crosspoint Capital Asia makes no representations or warranties regarding the accuracy, completeness, or timeliness of the information provided. We do not guarantee any specific investment outcomes or returns. Please refer to the disclaimer page for further details.