

In August we described two coordinated interventions inside twenty days and asked whether we were witnessing the early days of a reserve-currency wobble. September delivered the first empirical confirmation of that thesis — not in the price of the dollar, but in the composition of the people who still want to own US paper. Simultaneously, the equity bull case cracked from two directions at once: breadth collapsed to levels seen three times in a century, and the token economy that underpinned the AI narrative was undercut by open-weight competition. This month’s note walks through those two confirmations, explains why gold now sits at the centre of our allocation rather than the edge of it, and sets out the tactical positioning that follows.
Nobody wants US debt — and this time the data agrees
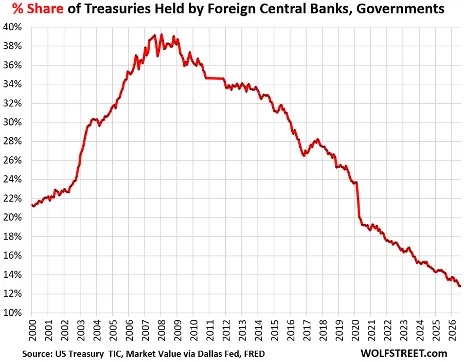
The single most important datapoint of September was buried in the Treasury International Capital release and is worth stating plainly: foreign official institutions have halved their share of the US Treasury market in seventeen years, and the pace of exit has quickened.
The share of US Treasuries held by foreign central banks, governments and other official institutions is down to approximately 13% – the lowest reading this century, versus roughly 39% at the time of the 2008 Financial Crisis (figure 1).
| Fig. 1 – Nobody wants US debt |
 |
| Source: Wolfstreet |
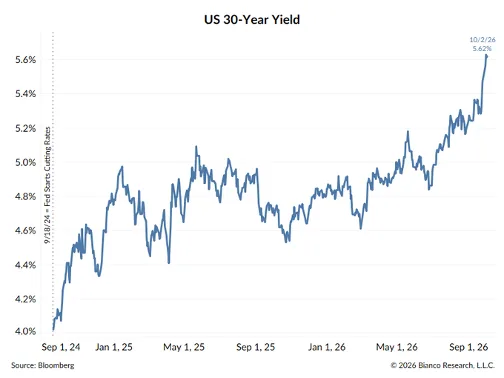
Between February and July alone, foreign official holdings fell by $237 billion to $3.77 trillion, the lowest in eighteen months. The world is not threatening to stop financing the United States at some point in the future. It is already doing less of it, quarter after quarter, in a trend that pre-dates the Trump administration and has survived every change of government since Lehman. The bond vigilantes are back and they are winning the day-to-day tape against an administration explicitly trying to hold yields down (figure 2).
| Fig. 2 – US rates are soaring |
 |
| Source: Wolfstreet |
Washington wants a strong dollar, high real yields on new issuance it can afford to service, and a debt load that compounds at a manageable rate. The arithmetic does not permit all three. A weakening dollar and financial repression – government policies that channel private funds to the public sector at below-market real rates — are, in our view, the two defining macro drivers of the decade now in front of us. September is the first month in which that framing stopped being a thesis and became a visible reality in the TIC flows.
The fiscal arithmetic underpinning this is now openly discussed by the people who used to minimize it. The present value of the US Social Security and Medicare financing gap over 75 years is approximately $95 trillion, or about 5% of the cumulative present value of projected US GDP across the same period — stacked on top of federal debt held by the public already projected at 101% of GDP in 2026. Europe is not visibly better once hidden pension liabilities are surfaced: EC estimates put net accrued public-pension liabilities at around 150% of GDP after future contributions, with gross pension promises at roughly 371% of GDP. “Short who loses first, long who loses second” is now our shorthand for an environment in which every major developed sovereign is impaired and only the sequencing is disputed.
The AI story cracks from both ends
Last month we flagged credit stress at the hyperscaler level and a token economy disinflating at the wrong moment. September delivered the second instalment of each.
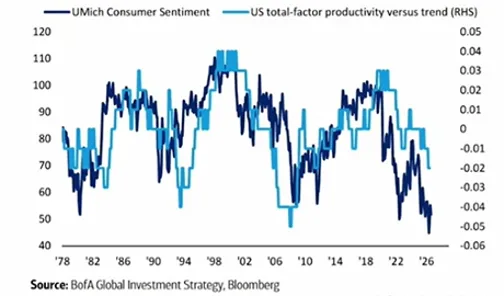
The token side is now unmistakable. DeepSeek V4.1 Flash has reached roughly 98% of GPT-6 Astra’s benchmark score at approximately 1.4% of the cost on everyday design tasks. MiMo-V2.6-Pro-RL, a 1.02 trillion parameter model with 42 billion active parameters, scores within a single point of GPT-5.6 Sol Max on capability and intelligence benchmarks. Translation: the frontier is becoming replicable on eight RTX PRO 6000s, and the price of a unit of intelligence continues to collapse. This is the variable we identified in June as the entire bull case’s single point of failure. The economy-wide return on $1.5 trillion of AI spending across the past three years remains conspicuously absent — total factor productivity continues to fall below trend, a measure historically well-correlated with consumer confidence (figure 3).
| Fig. 3: Total factor productivity falling below trend |
 |
| source: Bofa |
The equity market has not yet absorbed this. BofA’s September fund manager survey has “long semiconductors” as the most crowded trade for the fourth consecutive month at 53%, with a record 33% citing corporate overinvestment as the primary macro risk and “short Treasuries” climbing to second place at 18%. This is a crowd that already has one foot pointing at the exit.
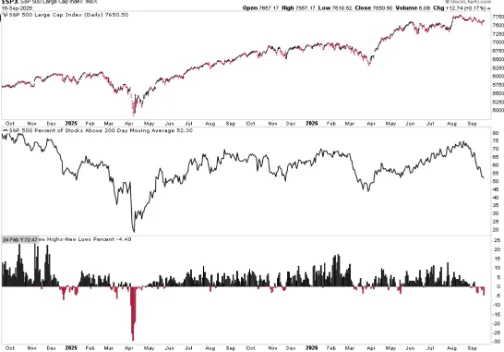
The equity leg is where the technicals have moved decisively. US market breadth is now the worst in almost a century: the S&P is pressing new highs while the number of individual stocks at 52-week lows exceeds those at highs, and the proportion of names in long-term uptrends is collapsing (figure 4). The only remotely comparable setups in modern market history are January 1973 and November 1999. Six-month realized S&P correlation sits at approximately 0.15, versus a 0.15–0.65 historical range — a reading touched on only three prior occasions. Both of those prior low-correlation episodes resolved to the downside once a common factor re-asserted itself. Our view is that the common factor is already visible in the Treasury complex; the equity market is simply the last to re-correlate to it.
| Fig. 4: S&P500 prints new highs with many stocks at lows |
 |
| Source: CCA |
Gold is no longer an edge position — it is the center
The road to building AI will almost certainly be inflationary before it becomes disinflationary. That alone is a sufficient framework for the trade.
The Fed is now, in a practical sense, AI-dependent as interest rates themselves have become AI-dependent, because the capex cycle is now large enough that its financing terms set the marginal cost of money for the rest of the economy. Build-out of this scale is unambiguously inflationary in the near term — power, land, grid upgrades, cooling, skilled construction labor — and only disinflationary later, if and when productivity gains actually materialize. Underlying inflation remained hot in September even as headline PCE cooled, consistent with that framing. For an investor, the implication is simple: hold gold. The intuitive single-datapoint evidence of September is that the Bitcoin-to-gold ratio has risen to 18.17 ounces per Bitcoin, its highest since January — hard assets, in both their analogue and digital forms, are being bid against the same backdrop. We retain our long gold / short silver pair at a 0.4 ratio from July, and would now view that pair as our single highest-conviction position across the book.
Tactical cross-currents and the TACO hedge
Two September developments complicate the directional read and are worth sizing honestly.
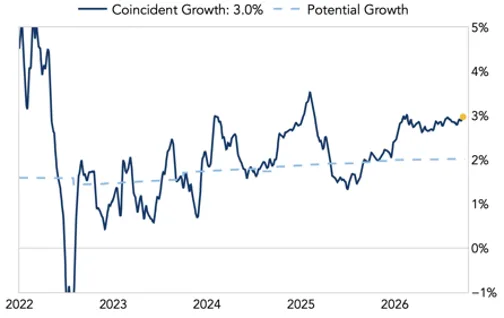
First, the labor market picked up more than expected: private-sector payroll growth averaged roughly 75K across the three months to August, with ex-health/education payrolls at 48K after spending most of 2025 in negative territory; the diffusion index rose to its highest since 2024 and temporary-help employment began to rebound. This is not a labor market demanding immediate rate cuts, which is one reason the long end has struggled to rally despite Treasury’s willingness to backstop it. Second, the end-of-month tape saw rates rising globally into record equity inflows, driven in part by a renewed surge in energy prices with the market now pricing another 25bp of US hikes; the US daily GDP growth estimate has climbed to 3%, well above potential (figure 5).
| Fig. 5: US coincident and potential GDP growth |
 |
| Source: Augur Infinity |
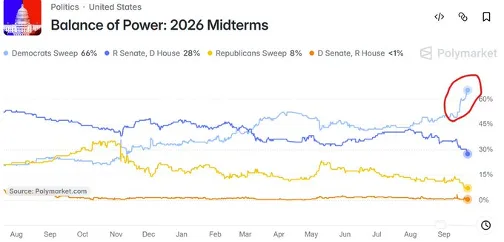
This is a messy regime — a hot economy, a hot inflation nowcast and a bond market demanding more term premium — and it is in that specific environment that we have added two tactical hedges. The VIX call spread (long October 17 / short October 25, roughly $1.80 debit) finances itself off an extreme upside skew and is our preferred expression of insurance that pays if the correlation regime. The TACO (“Trump Always Chickens Out”) framework — the pattern in which rising Democratic midterm odds force the administration to soften whatever hardline stance is damaging Republican prospects — gives risk assets an asymmetric path higher if the climb-down arrives, and we size accordingly (figure 6).
| Fig. 6: US coincident and potential GDP growth |
 |
| source: Polymarket |
Positioning: hard assets as core, tech as a rental
The core allocation has not changed. The tactical sleeve has whipsawed, as it should in a low-correlation regime.
Core: long gold with the paired silver short at 0.4; the energy-of-AI basket built around XLU, URA and GRID; PPA and ITA in aerospace & defence; Turkey ETF on the dollar leg; long Brazil; credit, dividend, insurance and communication services via the macro regime allocation. Though fixed income remains out of long duration as the fiscal arithmetic above is a continuing argument against carry at the back end, we note that retail investors try to buy the back of the curve since the early days of October. In this market, we still favor volatility-control solutions, remaining long trend-follower ETFs via DBMF to hedge the book dynamically.
Tactical: our tech sleeve was reloaded on 9 September, trimmed on 22 September as ARTY and ARKG positions were reduced on breadth concerns, and re-entered by 30 September as the TACO/midterm setup firmed. We treat tech as a rental in this regime, not an own-and-hold, and we size it against the VIX call spread as its hedge. In digital assets, we hold Bitcoin as the cleanest referendum on the credibility of monetary and fiscal policy.
The June note observed that the market’s calm was borrowed. The July note said the plumbing had begun to speak in a different voice than the tape. The August note said the strain had migrated to sovereign paper and asked whether this was a reserve-currency wobble. September answered: foreign demand for US Treasuries has halved in seventeen years and continues to fall; breadth is at a hundred-year extreme; and the single variable the entire AI bull case rests on is being arbitraged away by Chinese open-weight competition. We are not calling a crash. We are calling the regime in which hard assets stop being a defensive sleeve and become the core of a serious portfolio. We continue to rotate accordingly.
The information, opinions, and analysis contained in this publication (“The View”) are provided by Crosspoint Capital Asia Pte. Ltd. (UEN: 201010341G) for informational purposes only and do not constitute investment advice, recommendations, or solicitations to buy or sell any securities or financial instruments. Market Commentary & Opinions: All views expressed herein represent the opinions of Crosspoint Capital Asia as of the date of publication and are subject to change without notice. These opinions are based on current market conditions and may not reflect future market performance. Not Investment Advice: This content should not be construed as personalized investment advice or recommendations tailored to your specific financial situation, investment objectives, or risk tolerance. Investment decisions should be made only after consultation with qualified financial advisors who can assess your individual circumstances. Risk Disclosure: All investments carry inherent risks, including the potential loss of principal. Past performance is not indicative of future results. Market conditions, economic factors, and geopolitical events can significantly impact investment performance. No Guarantee: Crosspoint Capital Asia makes no representations or warranties regarding the accuracy, completeness, or timeliness of the information provided. We do not guarantee any specific investment outcomes or returns. Please refer to the disclaimer page for further details.